

Obviously there are many ways to slice and dice data. As I said in the last post, you first must have access to the data and I am finding that many organizations continue to hold diversity related statistics close to the vest, not even allowing the diversity office to have access.
Susan McCuistion, a senior consultant with The Winters Group, has helped us to categorize the types of data that you might want to collect.
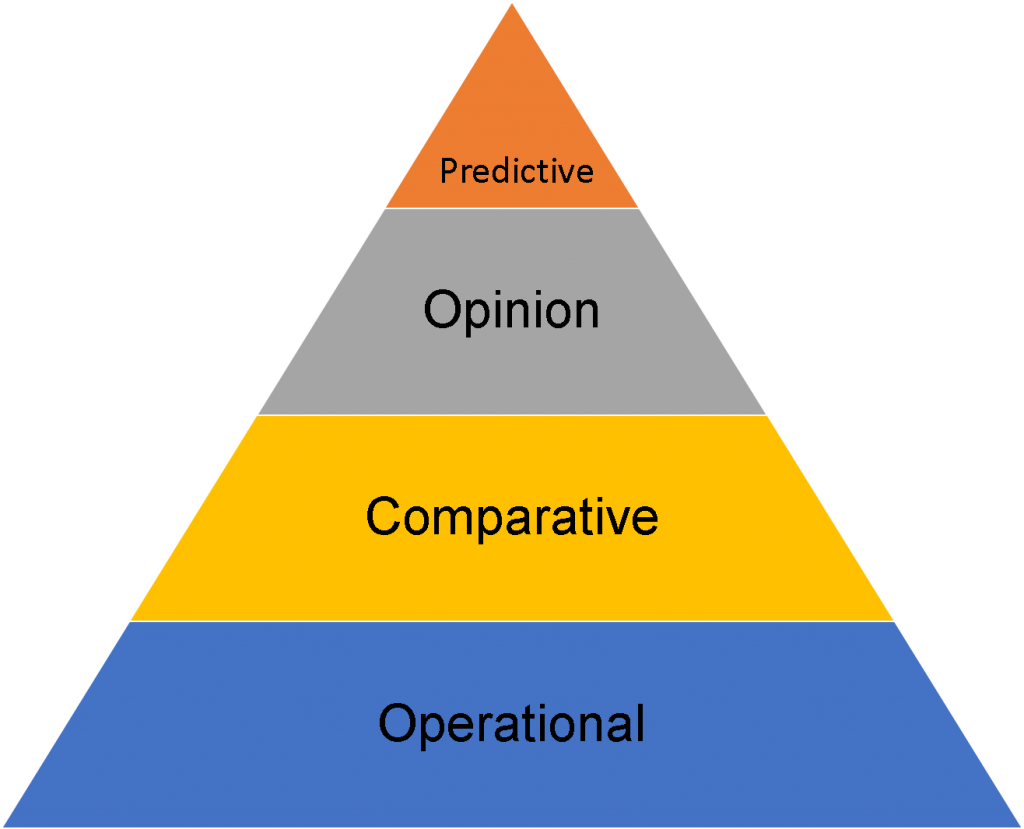
Operational data provides the most basic and easiest measures to obtain. Applicant flow, hiring, promotions, and terminations might be collected as part of an operational review. Operational metrics are early indicators that something needs to be addressed.
Comparative metrics allow you to analyze points in time, across locations, by different demographic groups, benchmark different companies, etc. More robust than simple operational data, comparative analysis can point to areas that may need more urgent attention than others. More sophisticated statistical approaches are also possible with comparative metrics to test for statistical significance in the differences.
Combining operational and comparative data allowed one client to graph exactly at what level women hit the glass ceiling compared to men.
Opinion data provides us with both qualitative and quantitative measures that provide deeper insights into operational or comparative results. Focus groups, surveys that query employees about their satisfaction and engagement would be examples of opinion data. I find that some organizations do not optimize the potential of this type of measure by failing to ask specific questions about inclusion and or by not segmenting the data by demographic characteristics such as race/ethnicity, gender, generation, function, location, etc. One of our clients actually broke the Asian population out by Southeast Asian and Northern Asian countries. They found significant differences in employee experience between the two groups.
In another situation, through comparative analysis the client learned that Latino men were twice as likely to be involuntarily terminated as white men. Through a series of focus groups with current Latino employees and interviews with leaders, they were able to pinpoint the root cause of tardiness which was linked to unreliable transportation.
Predictive analyses are the most strategic of the different data types. Utilizing all of the information available from the other three, predictive measures give a picture of what the future may look like. You can model different scenarios and understand, using multivariate statistical techniques such as multiple regression, and factor analysis, what variables will most influence future outcomes.
For example, for one client, we predicted, based on past hiring and retention operational results, what their projected representation of women would be in five years. They were surprised to learn that if they continued at the same pace, their representation of women would actually decline.
Many best practices diversity and inclusion departments actually have full time staff to support data mining.


