
Take a moment to review and reflect on the three graphs below. Each is a stark reminder of disparities within our society: the racial wealth gap, the high suicide rates among American Indian and White males, and the daunting economic challenges facing Millennials.
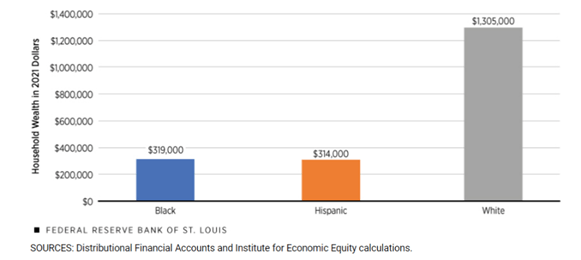
Average Wealth by Primary Race or Ethnicity:
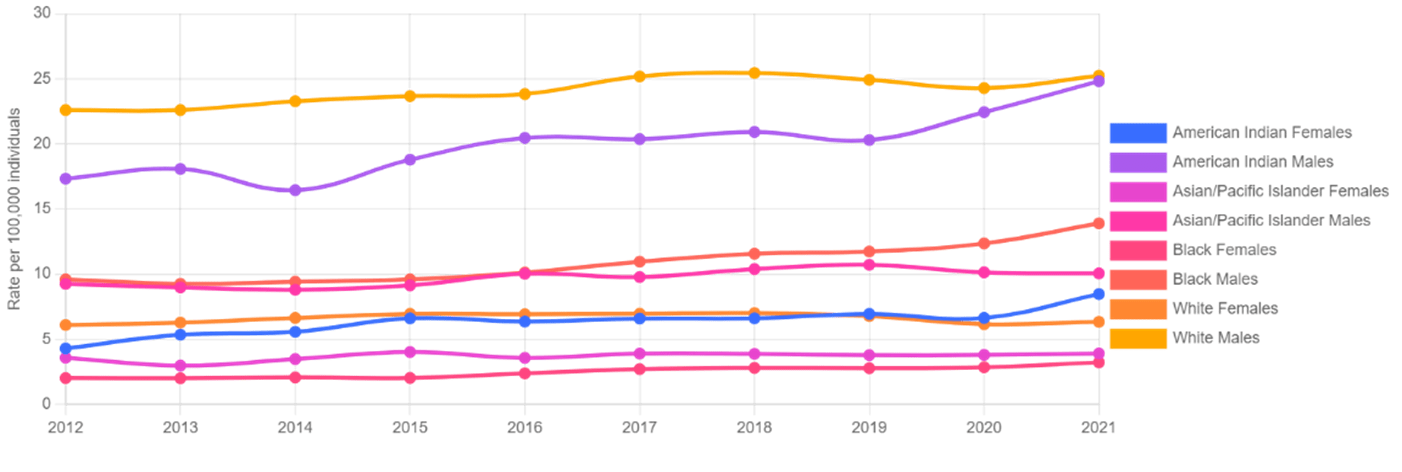
Suicide Rates by Race and Gender:
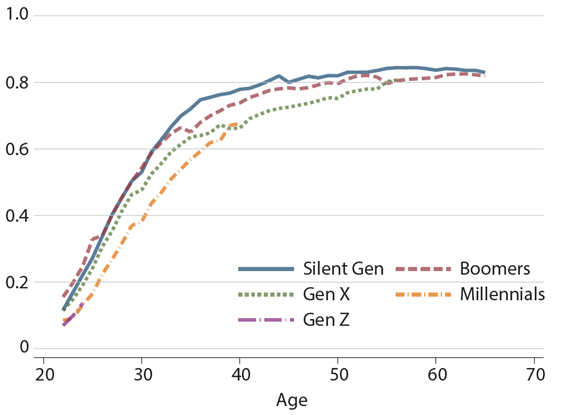
Homeownership Rate for College Graduates by Generation:
These examples are but a few in a broader tapestry of inequity in the U.S. From the disability employment gap and maternal mortality rates, to challenges faced by immigrants, refugees, and veterans in accessing healthcare and support, each issue is a critical facet of the larger picture.
While this article highlights three specific inequities, its theme is a multifaceted nature of disparity that is the “New Normal.”
Gallup highlighted this new normal in two articles about a general decline in life ratings and physical health across the U.S. population. The first Gallup article highlights a concerning trend in the U.S., where the percentage of Americans classified as “thriving” has diminished, only surpassing figures from the Great Recession and the COVID-19 outbreak. Notably, the rate of individuals classified as “suffering” has exceeded 4% for the fifth time in six quarters, a rate rarely seen in the dataset’s history. The second Gallup article sheds light on the deteriorating state of physical health in the U.S. post-pandemic, with key metrics like diabetes and poor eating habits notably worsening.
I asked us to reflect on the three graphs not to prioritize these inequities in particular, but to foster a shared empathy and concerted action to reduce inequities of all kinds. Ponder this question: Do these graphs collectively stir a sense of empathy within you, and if so, to what degree? Reflect on why your emotional response might vary across these different, yet profound, representations of inequity.
Again, this is not about ranking or prioritizing inequities, but about weaving a narrative of shared empathy and concerted action for all forms of disparity, underscored by the understanding that many suffer in these challenging times.
Racial Wealth Gap:
The first graphic displays the vast wealth disparities between Hispanic and African American families compared to their white counterparts.
The racial wealth gap is not just a statistic—it’s the reverberation of centuries of systemic disenfranchisement rooted in historical injustices like redlining and discriminatory lending practices. This chasm, particularly glaring between Hispanic, Black, and white households, reflects a persistent and pervasive disparity that casts a long shadow on generations.
In the second quarter of 2023, the average wealth for Black households stood at $319,000 and for Hispanic households at $314,000, as reported by the Federal Reserve Bank of St. Louis. In stark contrast, white households had an average wealth of $1,305,000. This disparity translates to a heartbreaking reality: dreams deferred, generational disadvantage, and a stark difference in economic security across racial lines. As we untangle the roots of these disparities, we cannot ignore the weight of the past on the present nor its chilling impact on future generations.
Suicide Rates by Gender:
The second graph starkly illustrates alarmingly high suicide rates among American Indian Males and white men.
Behind the masks sculpted by societal expectations lurks a grim reality: the disproportionately high suicide rates among American Indian and white males. In 2021, suicides among American Indian males were recorded at an estimated rate of 27 per 100,000, closely followed by white males at an estimated rate of 30 per 100,000, the highest observed in the data. This disparity is even more pronounced when compared to American Indian females at approximately 25 per 100,000 and other groups, with Black males at an estimated 17 per 100,000 and Asian/Pacific Islander males at 12 per 100,000.
These statistics illustrate unseen struggles, a battle against stifling norms, the crushing weight of stigma, and the suffocating expectations of masculinity. This disparity is a silent epidemic demanding empathy, understanding, and immediate action.
Generational Inequity – Homeownership:
The third graph highlights the significant lag in homeownership and wealth accumulation faced by Millennials compared to Baby Boomers at the same age.
For Millennials, the once-assured path to homeownership—a cornerstone of wealth creation and intergenerational mobility—has become a distant mirage. This stark generational inequity isn’t just a feeling; cold, hard data back it. At 30, only 38% of college-educated Millennials owned homes, compared to 54% of similarly educated Baby Boomers at the same age (St. Louis Fed, 2023).
This chasm reflects a confluence of economic headwinds:
- Wage Stagnation: Adjusted for inflation, median real wages for young adults haven’t budged since the 1970s.
- Student Debt Burden: Millennials grapple with an unprecedented student debt crisis, averaging $43,000 per borrower.
- Soaring Housing Prices: Median home prices increased two times faster than income since 2000, outpacing wage growth and further constricting affordability.
This inequity is not merely a financial hurdle; it has profound social and psychological ramifications. Delayed homeownership translates to deferred wealth accumulation, limited family formation, and heightened economic insecurity for Millennials. As the gap widens, we risk replicating and amplifying existing inequality across generations.
Conclusion
This article does offer a solution; it asks for your reflection. As you reflect upon the different emotional reactions these graphs may have elicited, consider the power of empathy in driving change. Let this serve not just as a commentary on disparity, but as a catalyst for understanding, dialogue, and action. By recognizing and empathizing with the multifaceted nature of inequity, we can begin to weave a new societal fabric that values diversity, promotes equality, and nurtures the well-being of all its members.


